In short: the method in one minute: take the noise out first, score and group what’s left, follow it over time and line it up with your KPIs to see what moves together. Then act and check the lines again.
Sign-ups are down. Churn is up. The dashboard tells you that much. Then comes the hard part: why?
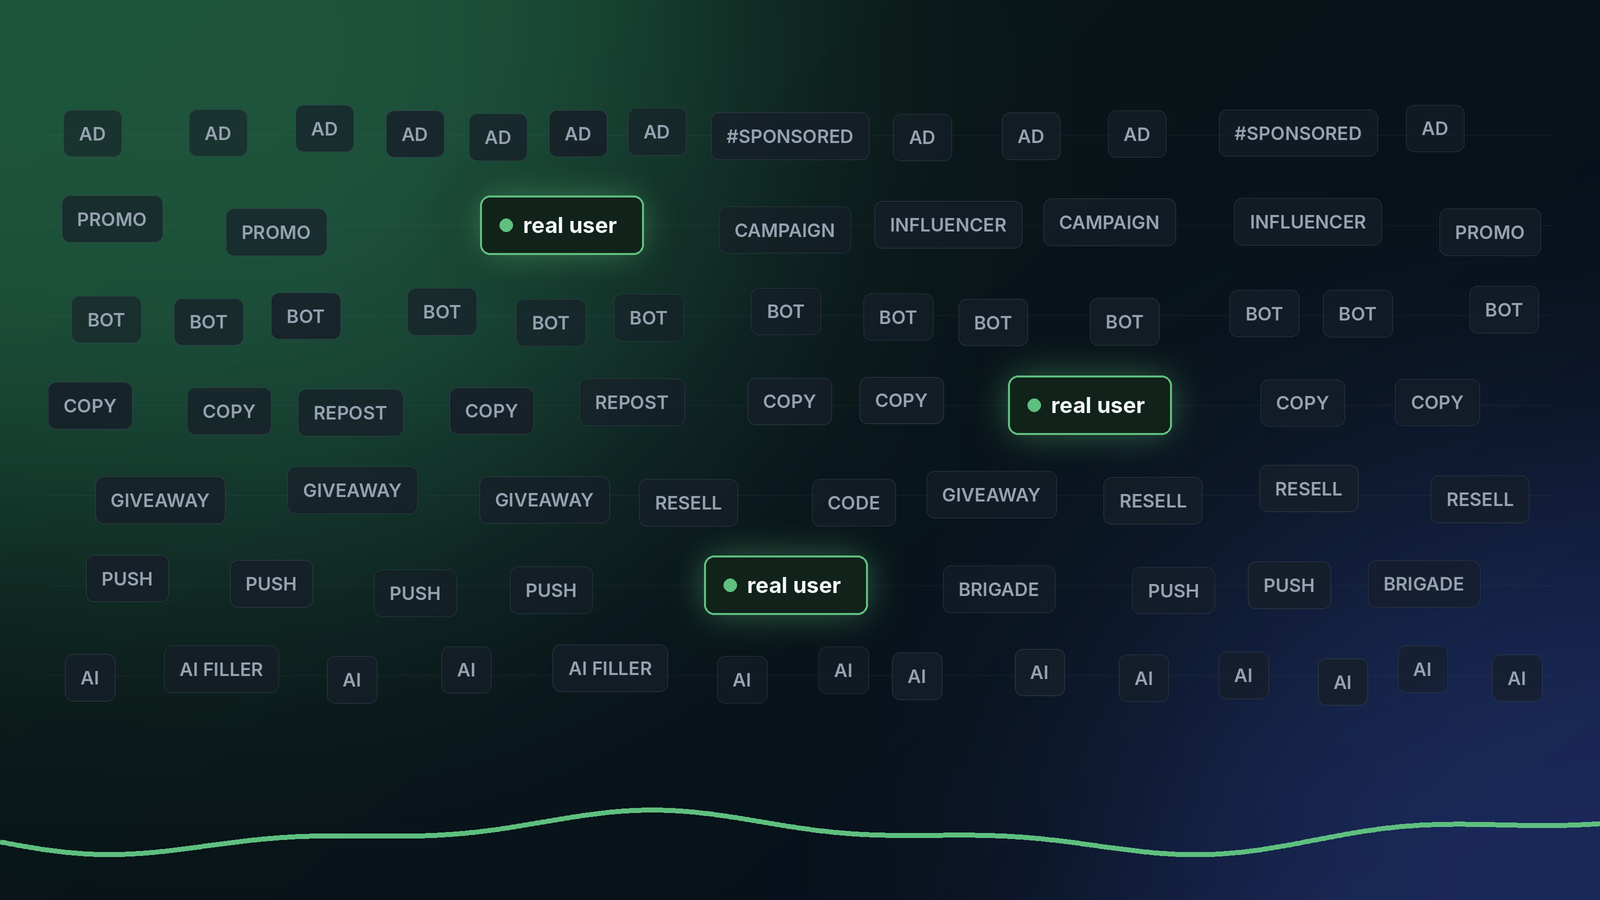
The answer is in what people say. But most of what people say isn’t people. It’s bots, ads and duplicates. Most of it is paid for or automated, and it drowns out the few voices that explain your numbers.
We made a one-minute walkthrough of how we handle it. Watch it first, then read the steps below.
Illustrative example. The numbers and quotes in the video are made up. They show the method, not a customer result.
1. Take the noise out first
Most of the raw data is noise. Bots, ads, duplicates, copy-paste waves. If you count it, you count the wrong thing, so we filter it before anything else. What’s left is a small part of the feed, and it’s what real people wrote. The anatomy of noise goes through the seven kinds we take out.
2. Score what’s left by sentiment
Every piece of unstructured data gets a sentiment score, from positive to negative. That tells you how people feel, and when.
3. Group it by meaning
Semantic clustering puts items with a similar meaning together, even when the words are different. “The new sign-up asks for too much” and “too many steps to register” land in the same group. You get topics, not a pile of posts.
4. Follow each topic over time
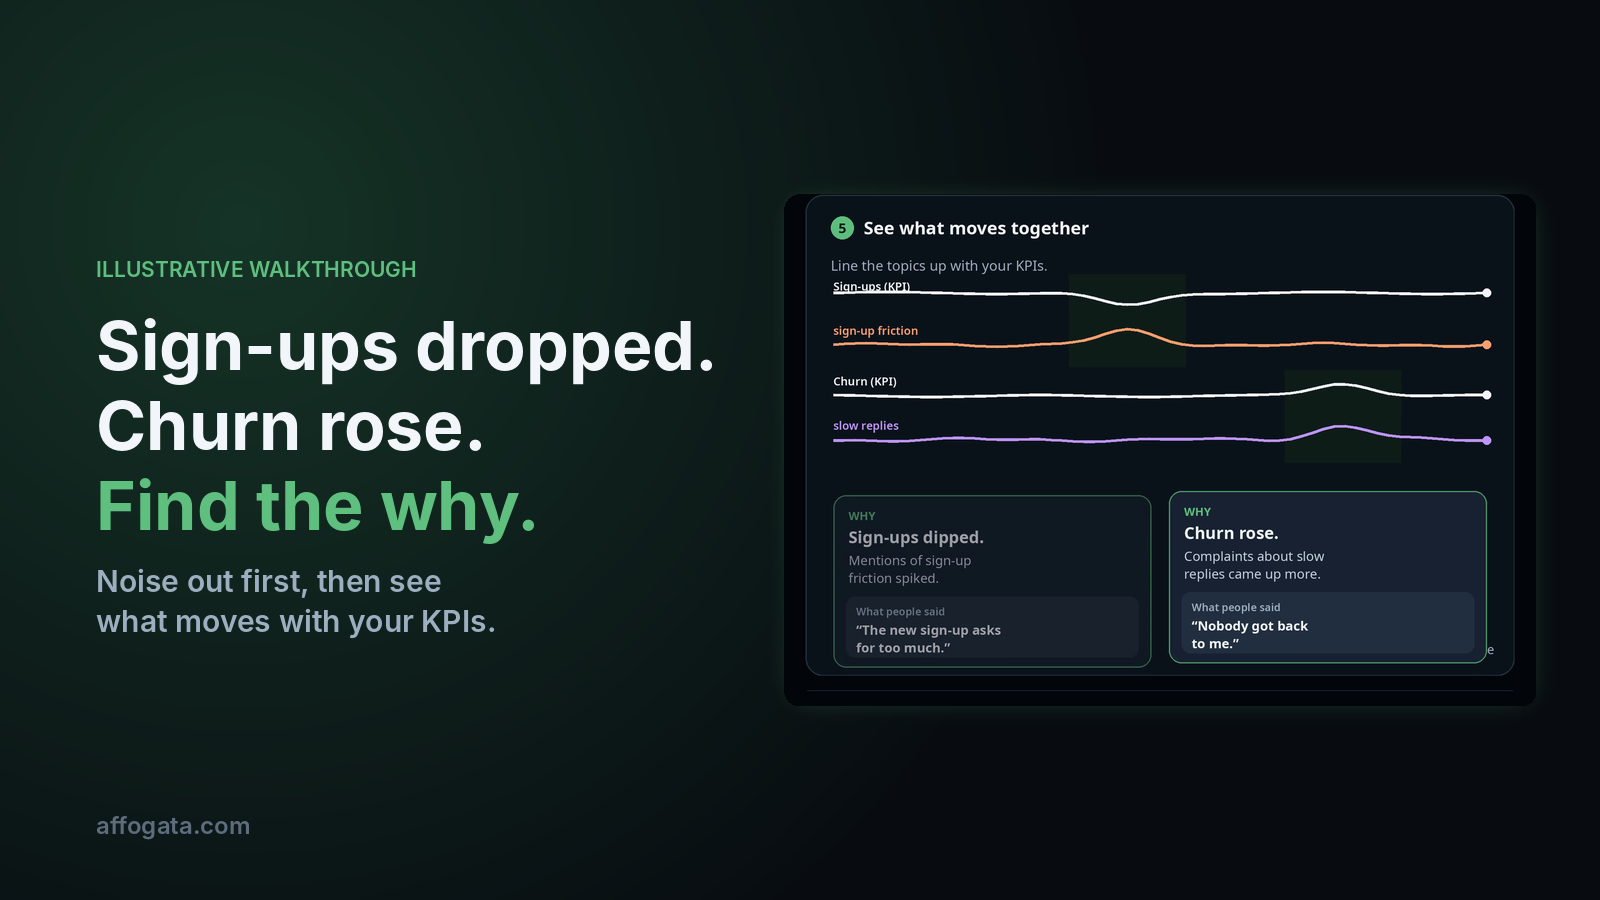
Each topic rises and falls. In the walkthrough, sign-up friction spikes at one point and slow replies grow at another.
5. See what moves together
Now line the topics up with your KPIs. In the example, mentions of sign-up friction rose when sign-ups dipped. Complaints about slow replies grew when churn rose. Each one comes with the real words people used, so you can check it yourself. It’s a rule we build everything on: every answer comes with its evidence.
This is correlation. It shows what moves together. Your team decides what it means.
6. Turn it into an insight and actions
The insight in the example: a hard sign-up step and slow replies move with the drop in sign-ups and the rise in churn. The actions that follow are simple: simplify the sign-up step and add reply capacity. Each action gets an owner, like Product or Support.
7. Ask the questions that matter to you
The same insight answers different questions. When to launch a campaign or an event. When to release. How a new release landed. How to improve retention. Pick the one your team cares about.
8. Get it where you work
Ask for it inside your AI assistant through the Affogata MCP connector. Get it in your own data warehouse, like Snowflake, Databricks or BigQuery. Or open a dashboard. If your data or security team has questions about any of these, here are the seven we hear most.
9. Act, then check the lines again
This is the part we like most. Act on the insight, then look at the same lines again. If the KPIs move the right way, you’ll see it. We don’t claim we caused it. We show you the lines and you decide.
Real insights from noisy data
That’s the whole idea. Any unstructured data in, the why out. Noise first, then sentiment, meaning, time and your KPIs.
Want to see it on real data? Our public benchmarks score nearly 80 consumer brands every week with the same method. Or try it on your own questions in the free MCP sandbox.
FAQ
Does Affogata predict what will happen next?
No. We correlate. We show which themes moved together with your KPIs, and the real posts behind them. What to do about it is your team’s call.
Is the example in the video real?
No. It’s an illustrative example built to show the method. The numbers and quotes are made up.
What kind of data can it use?
Any unstructured data, from 40+ public and connected sources plus your own, linked to the business metrics you already track. Here’s one week across seven industries.
Where do I get the insights?
In your AI assistant through MCP, in your data warehouse, or in a dashboard.
Video transcript
Sign-ups are dropping and churn is rising. We need to know why. Most of it is noise: bots, ads, duplicates. We take it out first. Every piece of unstructured data gets a sentiment score. Semantic clustering groups items by meaning and shows how topics connect. Each topic is tracked over time. Line the topics up with your KPIs and see what moves together. We correlated the data and found the why. Then, what to do about it? The insight answers the questions that move your business. Delivered where you work: MCP, your data warehouse, or a dashboard. The KPIs are moving the right way. Real insights from noisy data.