Published October 13, 2026
Revenue is down. Downloads dropped. Engagement is lower, churn is up, sentiment turned negative, maybe the stock fell. Your dashboards and your data warehouse tell you all of that, quickly and precisely. That is what happened.
What they can’t tell you is why. And it is very hard to make a good business decision when you don’t know why.
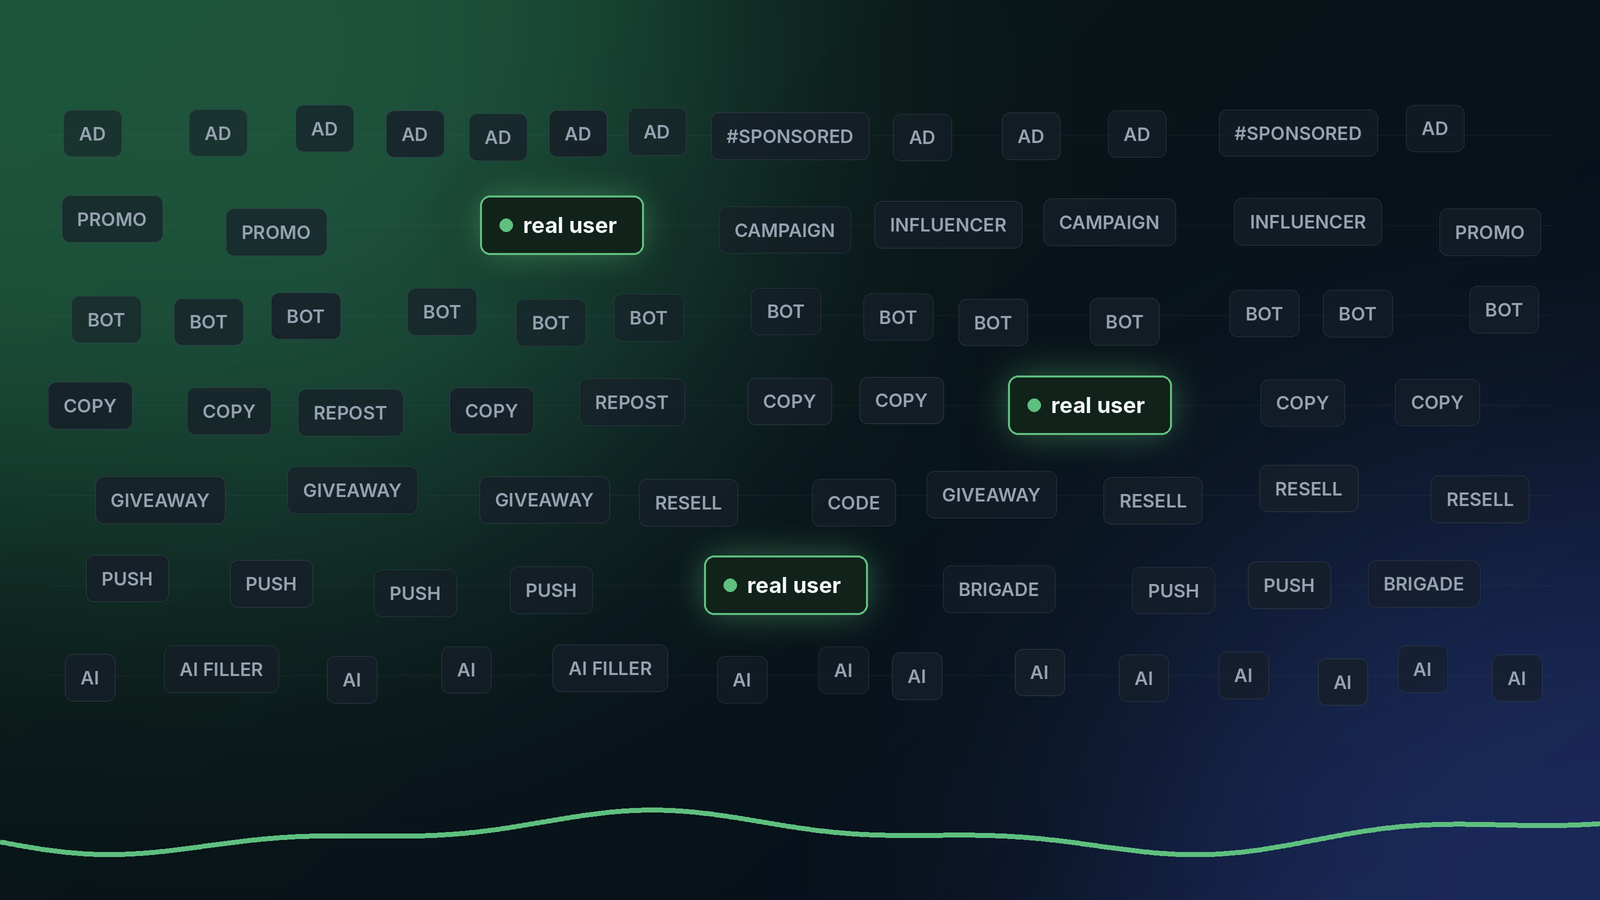
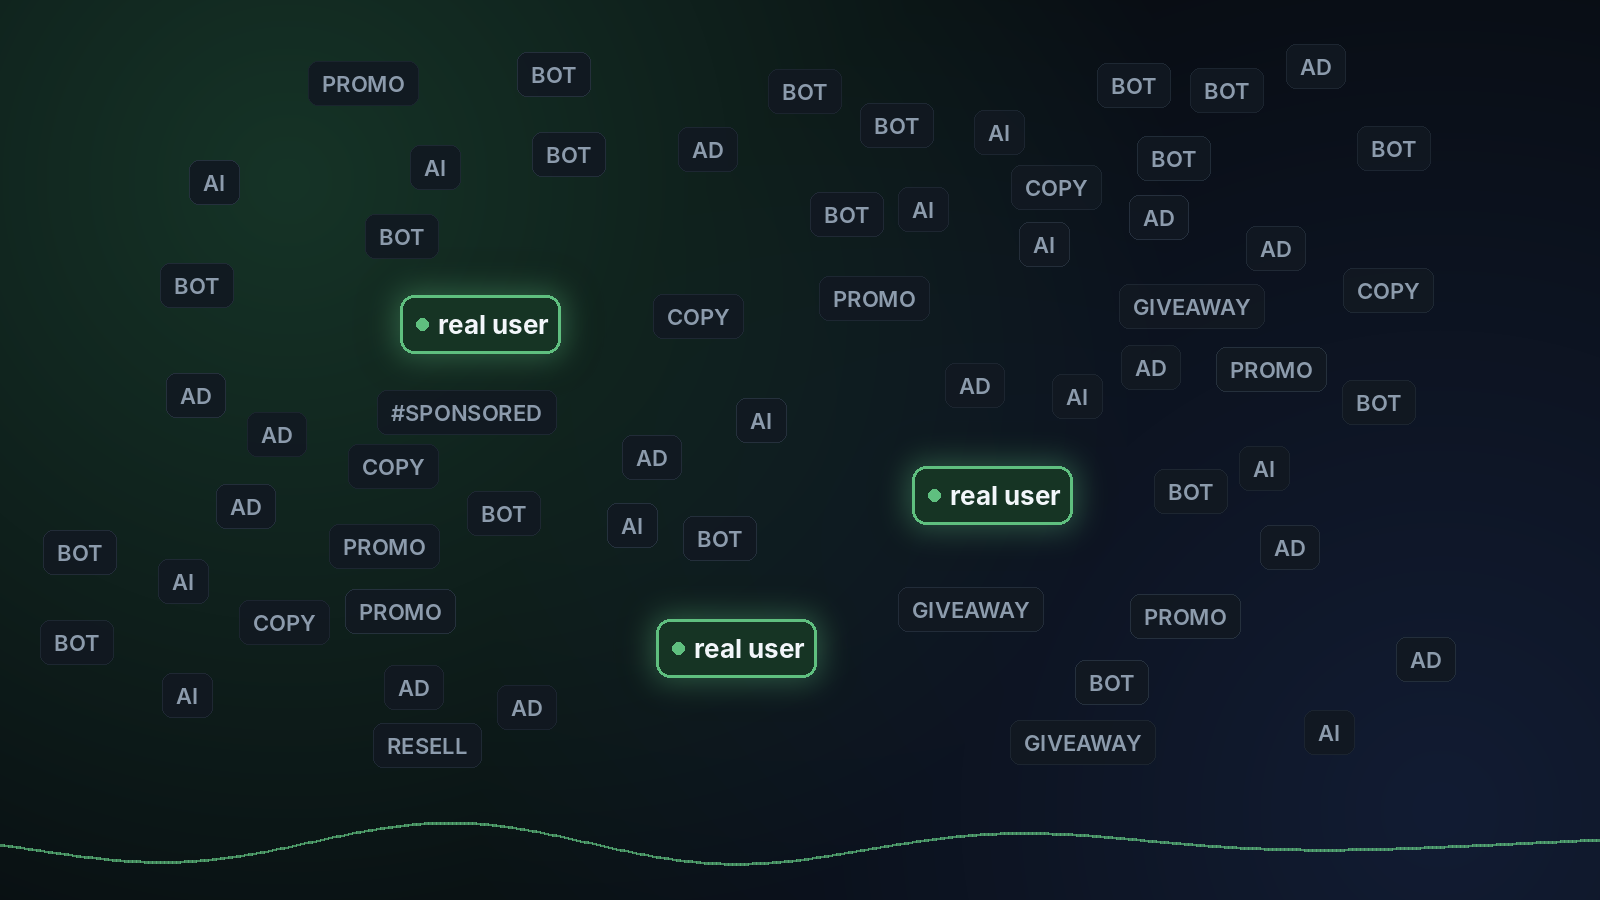
The why sits in what people say: reviews, posts, comments, communities, support tickets. The problem is that most of it is not your customers. Ads, bots, marketing campaigns, influencers, duplicates, coordinated pushes and plain market manipulation fill the feed. Only a fraction of the data is meaningful enough to base a decision on. Finding that fraction is the whole game.
At a glance
- What vs why: KPIs show what happened, not the reason
- Only a fraction is real: the kinds of noise money buys
- Deciding on polluted data: what goes wrong
- How we find the why: filter first, then correlate with your KPIs
- Any industry: gaming, fintech, apps, streaming, public affairs, funds
- Why you can trust it: proof behind every insight, enterprise compliance
- FAQ
Why don’t your KPIs tell you why something happened?
Because KPIs are counts of behavior. They tell you registrations fell 12% on Thursday, not that a new verification step broke sign-up on one phone model. The reason lives in unstructured data, in people’s own words, and that data is not in the warehouse next to the numbers.
So teams go the slow way: tickets, surveys, meetings, a few people reading posts. By the time there is an answer, the week is gone.
Why is only a fraction of the data meaningful?
Because noise is paid for, automated and amplified. A real user writes once, in their own words. Everything below can post a thousand times:
- Ads and sponsored posts, yours and your competitors’.
- Marketing campaigns and paid hype around launches.
- Influencers and affiliates, positive by design.
- Bots and coordinated accounts: many accounts, one message, one timing.
- Duplicates and copy-paste waves that look like a trend.
- Market manipulation: pump posts around a ticker, astroturfing around a policy or a brand.
- Giveaways, engagement bait, resellers and promo codes.
- AI-generated filler, written to farm reach, not to say anything.
And plenty more. None of it is fake data. It is real content. It is just not your customers telling you what they think, so it can’t tell you why your numbers moved. I broke down the seven most common kinds, and how each one gives itself away, in the anatomy of noise.
What happens when you decide on polluted data?
You end up explaining the wrong thing:
- Sentiment skews. Promo is positive, so a big campaign week looks like a great product week.
- Volume lies. A bot wave or a copy-paste push looks like a story. It usually isn’t.
- The real reason disappears. A bug report from a few dozen real users sits under thousands of giveaway comments.
- AI answers repeat the loudest thing. Ask an assistant to summarize raw posts and it summarizes what was posted most, often what was paid for.
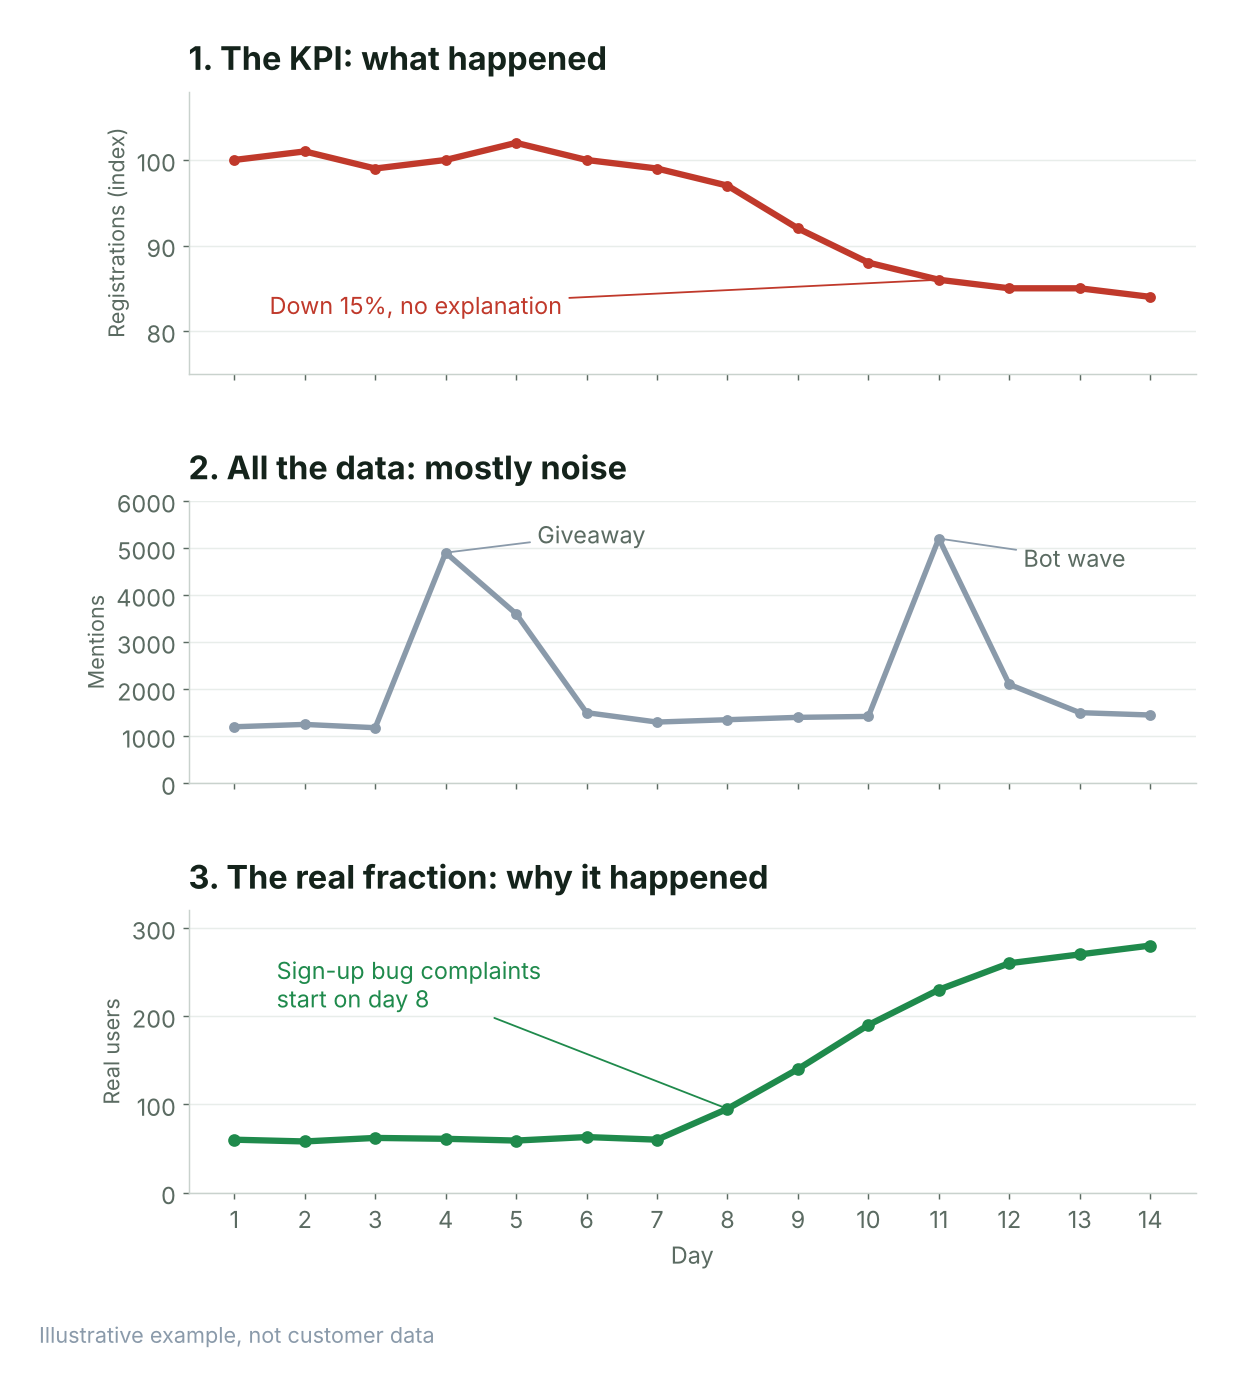
More data isn’t the answer. Knowing which data is real is.
How does Affogata find the why?
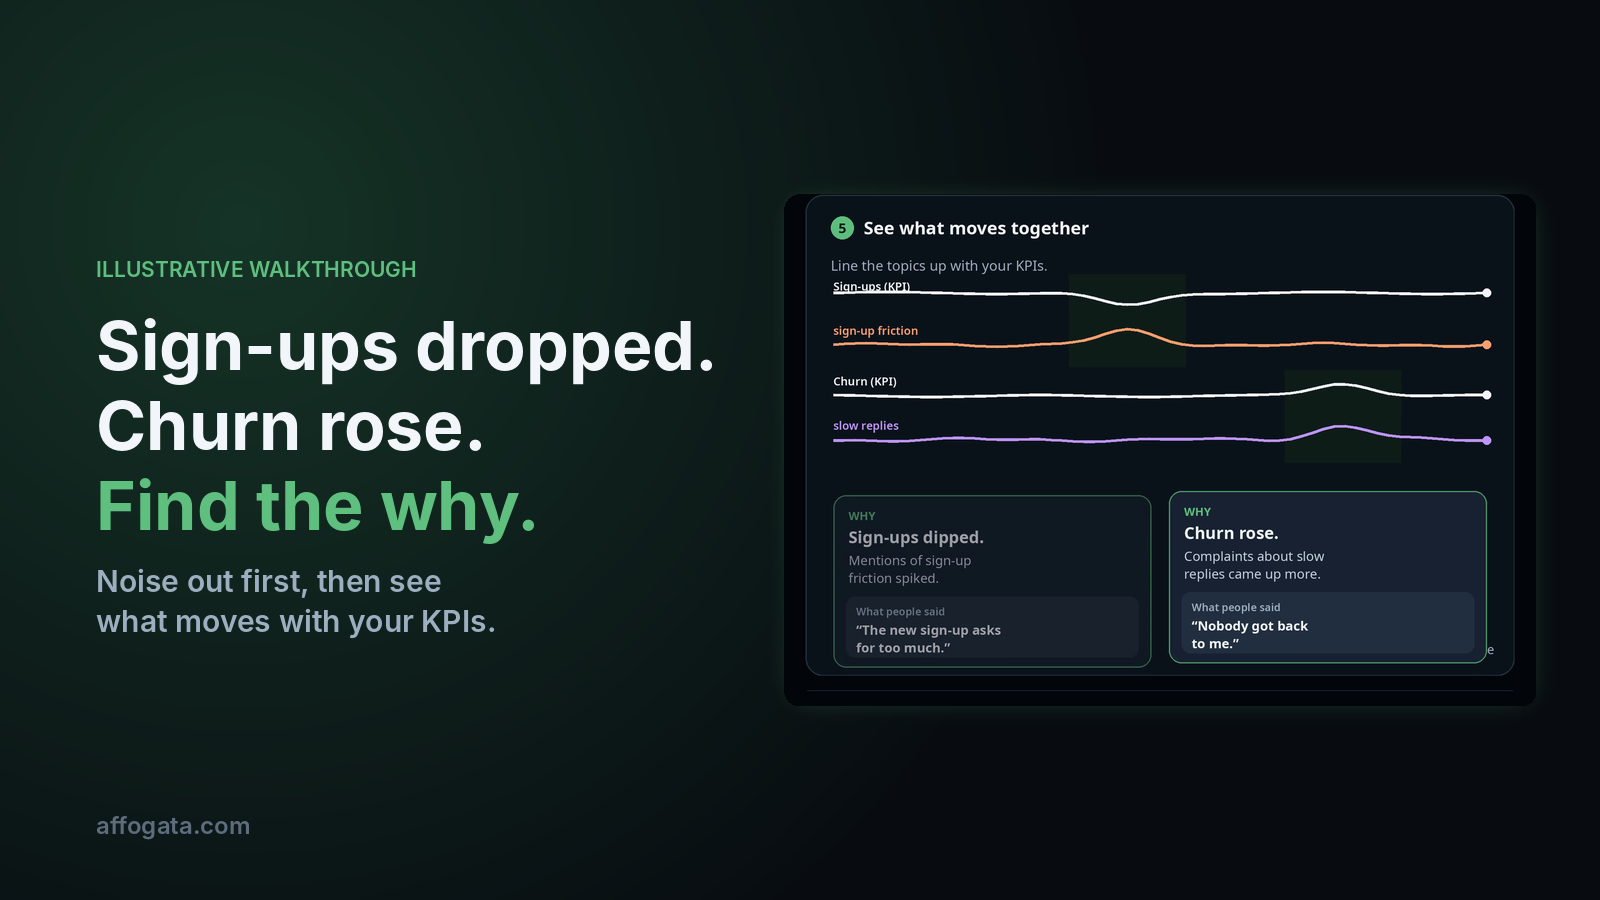
We filter before we count, then we line the real signal up with your numbers. Here’s the whole method in one minute, with a drop in sign-ups and a rise in churn as the example.
The noise patterns change all the time, so we keep adding new ones as they show up. Then we correlate the real signal with the KPIs you already track, from your warehouse or ours. When registrations drop, you see the theme that moved with them, and the posts behind it. Correlation shows what moves together. Your team decides what it means. For that to work, a number has to mean the same thing in the dashboard, the warehouse and the AI. That’s the foundation we build on.
Does this work outside gaming?
Yes. Gaming is where we started, because players are the toughest crowd online: slang, sarcasm, memes and a spam wave at every launch. The same layer runs on any unstructured data, in any industry. Some typical patterns:
- Fintech and trading apps: deposits drop. The feed is full of referral codes, the real conversation is about verification or withdrawal times.
- Consumer and subscription apps: churn goes up the same week a paid campaign lifts sentiment. Long-time users are reacting to a pricing change.
- Content and streaming platforms: engagement falls after a feature change, while creator promo drowns out what viewers actually say.
- Public affairs: one loud, coordinated burst looks like a shift in opinion. The real voters are talking about something else.
- Hedge funds and alternative data: the stock moves. Pump posts around the ticker are noise; real customers talking about the product are the signal.
Why should you trust the signal?
Two reasons. First, every insight keeps its proof: the real posts behind it, so you can check our work instead of taking a number on faith.
Second, the way it runs. We are ISO 27001, ISO 27701 and ISO 42001 certified, Microsoft SSPA approved, and GDPR and CCPA compliant. Access is read-only, permissioned and logged, personal data is masked, and your data is never used to train AI. We work inside some of the largest player and customer communities in the world, side by side with their teams, close to how an in-house data team would. If your data, security or AI team is the one asking, here are the seven questions enterprise teams ask before they trust the data.
If you take one thing from this post: your KPIs already tell you what happened. Before you decide what to do about it, make sure the why comes from real people.
FAQ
Why don’t KPIs explain themselves?
KPIs count behavior: revenue, downloads, churn, engagement. The reason behind a change usually sits in unstructured data, in what customers say, which is not stored next to the KPI and is mostly noise until it is filtered.
What kinds of noise does Affogata filter out?
Ads and sponsored posts, marketing campaigns, influencer and affiliate content, bots and coordinated accounts, duplicates and copy-paste waves, market manipulation, giveaways, resellers, promo codes and AI-generated filler. New patterns are added as they appear.
How does Affogata connect customer voice to business KPIs?
It correlates the filtered signal with the metrics you already track, such as revenue, downloads, registrations, churn, engagement and stock movement, so you see which themes moved together with a change and the posts behind them.
Is Affogata only for gaming?
No. Gaming is where we started. Affogata is the Unstructured Data Enablement Layer and works on any unstructured data, in fintech, consumer apps, content and streaming, commerce, public affairs, alternative data and more. Here’s what one week looks like across seven industries.
Can I use it in my own AI or data warehouse?
Yes. The same insights are available in the Affogata app, in your data warehouse (Snowflake, Databricks, BigQuery), in Claude, ChatGPT, Gemini Enterprise and Copilot through the Affogata MCP connector, and over the API. Try it on the free MCP sandbox.
Find the why behind your own numbers
Open the live Insights Model to see real events with the posts that prove them. When you want the same on your own data and KPIs, we’ll show you how it works.
Want more?
We are always happy to meet with you and your team. Set a meeting with the Affogata founders, Sharel and Itamar: